Introduction
Observability tools help engineering teams understand the health and behavior of software. But the term “health” in the context of this type of tooling is fairly narrow in scope—pertaining to real-time performance, reliability, and availability.
While these are three important metrics to monitor, they’re lagging indicators of bigger issues happening upstream. Things like consistency of ownership and on-call information, the presence of documentation, and absence of out of date package versions are not tracked by observability tools, yet all have a significant impact on a team’s ability to prevent or quickly resolve incidents.
In this blog we’ll share how data from observability tools combines with other inputs from across your stack to build a more holistic view of software health, and help prevent downstream issues.
How observability tooling helps ensure software health
The category of “observability tooling” is primarily made up of infrastructure monitoring, APM (Application Performance Management), and to a diminishing extent—log + error-tracking solutions. APM and Infrastructure Monitoring tools focus on identifying any issues that would result in users experiencing slowdown or disruption in the application or service. Log and error-tracking tools, on the other hand, enable forensic investigation of events so you can better unpack what might have led to an incident.
To investigate issues in performance, observability tools synthesize logs, metrics, events, and transactions related to a business’s network, infrastructure, and applications. Absence of observability tooling can slow remediation time, which can negatively impact customer experience. It’s no wonder that ensuring connection to logging and monitoring tools is now the most frequently cited item in software production readiness checklists.
Top use cases for observability tooling:
Root cause & impact analysi
Application optimization
Incident detection
Remediation acceleration
Platform security
Real-time data management
Cloud resource utilization
How IDPs extend observability data
Observability tooling has led the way in real-time visibility into the events behind software disruptions. Quick to set up, and easy to extract insights, these tools provide a lot of critical information about software health. Of course, we know reliability starts well before issues arise. How software is configured, which tools it’s connected to, and how many vulnerabilities persist all impact reliability, and software health as a whole. So what should we be using to track those dimensions?
Internal Developer Portals (IDPs) like Cortex enables teams to programmatically track all measures of software health in one common framework. What used to require manual analysis across multiple tools like code and vulnerability scanners, internal wikis, dependency management tools, identity providers, ITSMs, and observability tools, can now be centralized in one 'always on' system of record.
Building observability into software scorecards
Aside from acting as a central system of record for engineering, Cortex also enables teams to set ‘always-on’ standards using that same data, making it easy to bring observability, security, and operational efficiency inputs into one space. Just set requirements referencing each to initiate automatic and continuous checks on alignment to any standard you define.
Scorecards ensure continuous monitoring for alignment to standards, but how you build these standards is up to you. Choose between simple binary rules e.g. “has connection to Sentry” or “Has SLOs set in Datadog” or more complex threshold rules that are handy for keeping an eye on things like incidents and code coverage, e.g. “MTTR is less than 5 hours on average over the past week” or “code coverage is at least 90% for tier 1 services.” Set groups and weightings however you see fit, or pull from a selection of sample templates we provide.
To illustrate how you might want to incorporate observability data into your scorecards, let’s take a look at a few diferent ways Cortex customers do it today:
Stand-alone Observability Scorecards:
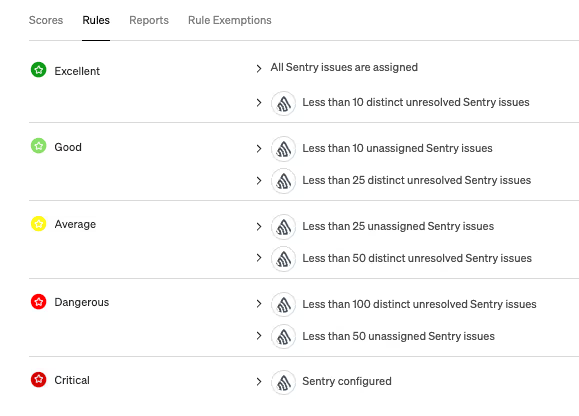
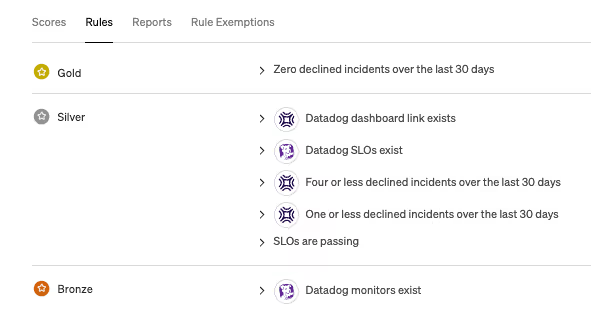
Customers with teams divided by functional areas rather than product lines might prefer to separate Scorecards by goal. In this scenario, scorecards are built to purely focus on observability, with rules just focused on connections to—or issues raised within APM, logging and monitoring tools. Examples below:
Onboarding Scorecards
Ensuring connection to observability tooling typically happens by default when onboarding new software, but actually enforcing that at scale can be difficult. Because of this, many customers add observability requirements to their onboarding scorecards, often in the form of ensuring APM tools are connected. Examples below:
Production Readiness Scorecards
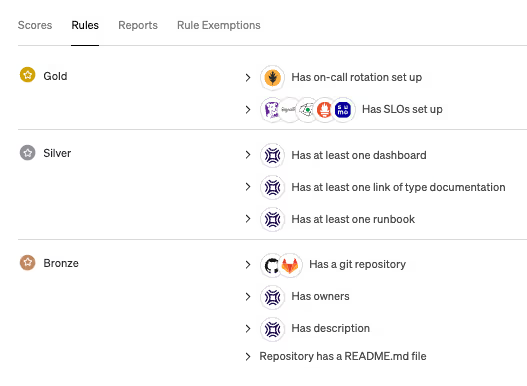
Production readiness is no longer just a “pre-deploy” consideration. Code, tools, and owners constantly change, and we now have a way to ensure software stays production ready, well past launch. Including observability requirements in a production readiness scorecard enables you to add rules that might not have made sense at launch, like defining SLOs or adding a runbook.
Helping you automate observability standards
Cortex enables you to not only create scorecards based on data from observability tools and all other data across your engineering stack, we also enable you to carve out specific rules that must be met by any deadline you determine. These “Initiatives” in Cortex help you drive alignment against the things you care most about. An example of a security-focused initiative is below:
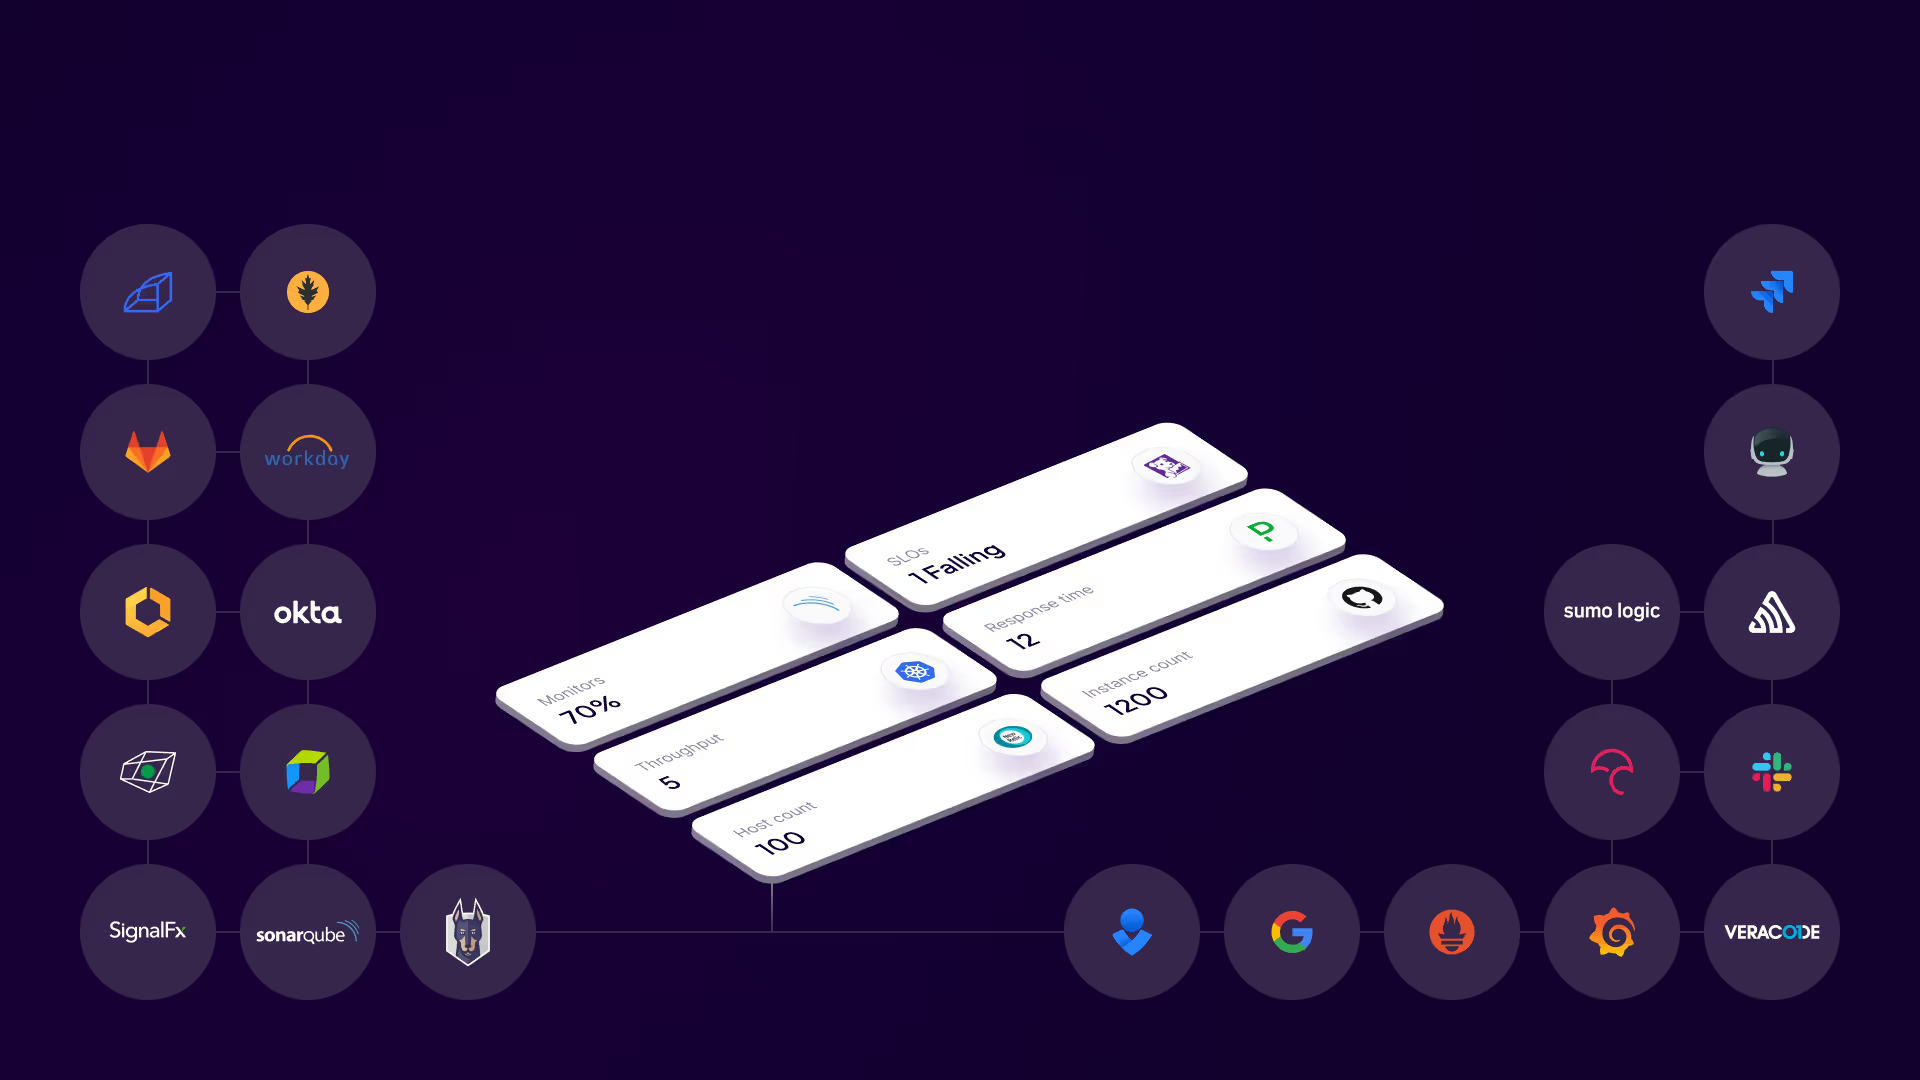
 As you can see above, there's no limit to the data you can use to build your scorecards. While we support data from anywhere—including internally-developed or niche third-party systems, we also offer 50+ integrations right out of the box. Our observability suite (APM, logging, monitoring, and error tracking) includes:
If you’re looking for a central place to manage standards related to observability, security, incidents, ticketing, and any other datapoint, check out our self-guided tour, or grab some time to chat with us today!
