For decades, engineering leaders have struggled to measure the productivity of their developers. Metrics such as number of PRs merged, lines of code changed, hours worked, and tickets closed were always flawed. They incentivized the wrong behaviors and ignored code quality and best practices. Ultimately, they were the perfect formula to make Goodhart's Law a reality. Measures became targets, which meant they ceased being good measures.
With generative AI tools capable of writing significant amounts of code, it's even more difficult to measure the productivity of a developer who is now part engineer, part AI collaborator.
The answer is to adopt a more holistic definition of productivity, one that balances the velocity of development with the quality and stability of the output. It requires looking beyond individual metrics to see the entire system, understanding how AI is impacting workflows, and knowing how to turn data into meaningful action.
Why quality is an equally important half of the productivity equation
A common pitfall of focusing solely on speed is that quality often suffers. A team might double their deployment frequency, but if that also doubles the incident rate, are they truly more productive? True productivity means that you're shipping better, more reliable software without burning out the team.
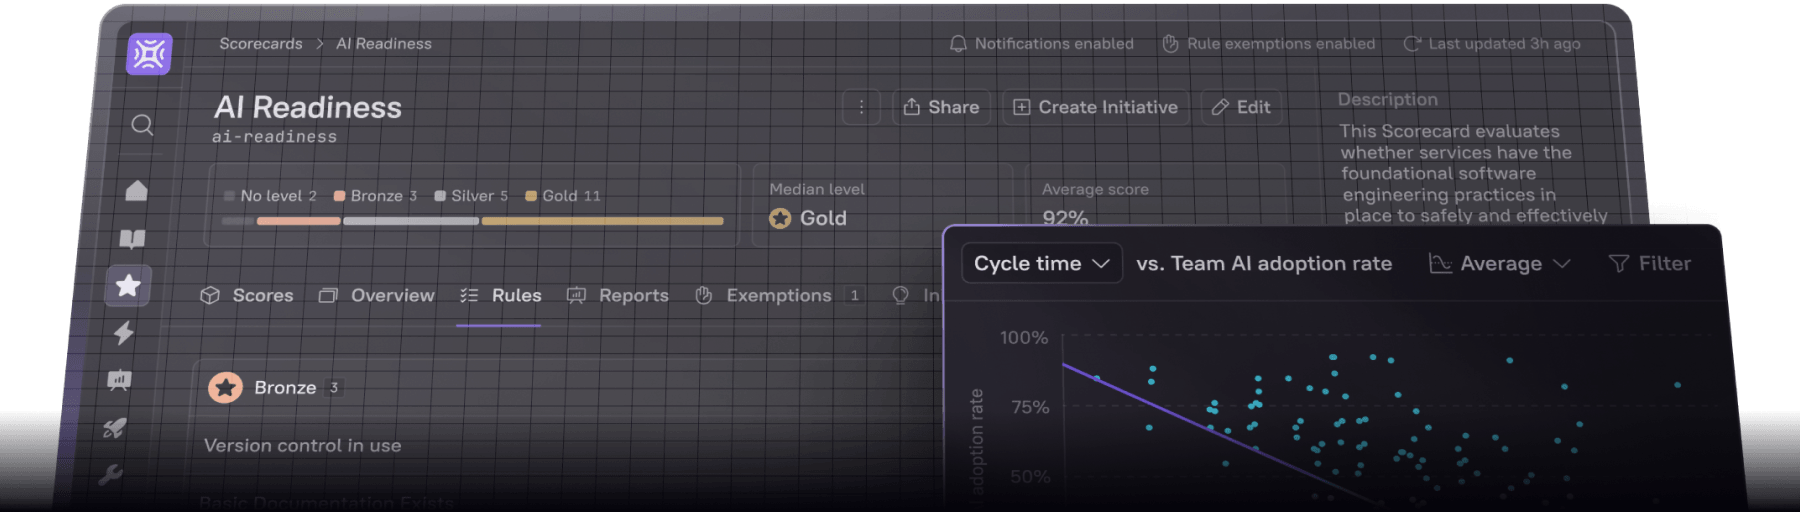
This requires balancing traditional productivity metrics with key indicators of quality and reliability. For instance, you should look at cycle time in the context of your change failure rate. If cycle time is decreasing while the failure rate remains low, it’s a strong signal of healthy, sustainable speed. But if a drop in cycle time is correlated with a spike in production incidents or a rising Mean Time to Resolve (MTTR), it points to underlying issues in your development process. A holistic view prevents you from optimizing one part of the equation at the expense of another.
A framework for modern engineering teams
To get a complete picture, it’s helpful to track a combination of metrics across your version control, issue tracking, and deployment tools.
Version Control Metrics: These are some of the most powerful indicators of your team’s day-to-day workflow health. Cycle time is the critical top-line metric, but it’s essential to break it down into its component parts, such as time to first review and time to merge, which will help you pinpoint specific bottlenecks in the PR process.
Issue Tracking Metrics: The number of work items a team completes in a sprint or a month provides a measure of overall throughput. When correlated with cycle time, this can help you understand if your team is consistently shipping smaller, incremental improvements or is bogged down by a few large, complex projects. Further categorizing this work by type (such as new feature development, bug fixes, and maintenance) is critical for understanding the balance between innovation and operational load.
Incident and Reliability Metrics: These metrics quantify the stability of your systems and the effectiveness of your response processes. Tracking Mean Time to Recovery (MTTR), Mean Time Between Failures (MTBF), and overall incident volume provides a clear view of how system changes impact the customer experience. They are the critical counterbalance to velocity metrics.
Deployment Metrics: The classic DORA metrics are still the gold standard for measuring the output of your DevOps practices. Deployment frequency and lead time for changes measure your team's velocity, while change failure rate measures the quality of your deployments. Tracking these provides an essential view of your delivery pipeline. If you want to dive deeper, we break it all down in our DORA webinar.
Measuring the impact of generative AI
Generative AI tools are fundamentally changing the development process. They can help engineers write code faster, but their impact on productivity and quality needs to be measured carefully. Are developers using AI to accelerate their workflows, or is it introducing new risks and code churn?
This is where an AI impact dashboard becomes essential. By analyzing how AI tools are being used, you can start to answer critical questions: Is AI adoption correlated with a decrease in cycle time? Is it leading to larger or smaller PRs? Are teams that use AI heavily shipping higher-quality code, or are they seeing a rise in bugs and rework? Understanding these dynamics is the first step to harnessing AI effectively.
How to drive meaningful change across your engineering organization
Collecting data is only half the battle. The real value comes from using that data to drive meaningful improvements. This is where a platform like Cortex's Engineering Intelligence becomes critical. It allows you to not only see the data but also to act on it with Scorecards and Initiatives.
For example, imagine you're concerned about how long it takes for teams to respond to critical incidents. High Mean Time to Acknowledge (MTTA) can turn a minor issue into a major outage. Here’s how you can use Cortex to drive change:
Diagnose the problem. Using Engineering Intelligence, you can see that MTTA is spiking, but the cause is unclear. Is it a specific team? A particular service? You might discover that the root cause isn't performance, but a lack of operational readiness—on-call schedules are misconfigured in PagerDuty, or responders don't have up-to-date contact information.
Set a new standard with Scorecards. You can create a new “Incident Readiness” Scorecard that codifies best practices. You can add rules to ensure every production service has a valid on-call rotation, requires at least two escalation tiers, and has responders with multiple contact methods (email, phone, and SMS). This makes the standard for readiness clear and measurable.
Drive change with Initiatives. Finally, you can launch an Initiative to drive all production services to the “Gold” tier on your new Scorecard. This gives teams a clear deadline and a way to track their progress, turning a vague goal—"improve response times"—into a measurable, trackable, and achievable outcome.
This framework can be applied to any engineering challenge. If you notice that time to first review is lagging, you can create a Scorecard that tracks PRs without review for more than 24 hours and launch an Initiative to reduce that number. To shrink the gap between approval and deployment, you can use Cortex Workflows to automatically trigger CI/CD pipelines when a PR is merged. To improve code quality, you can set a standard for 80% test coverage in a Scorecard and create tiers (e.g., Bronze, Silver, Gold) to help teams incrementally improve their practices.
By connecting insights to action, you can systematically eliminate bottlenecks and create a culture of continuous improvement, turning your productivity data into a powerful engine for change.
Ready to turn productivity insights into a culture of continuous improvement? See how Cortex can help you eliminate bottlenecks and empower your team to do their best work. Book a demo today.